The Gold-Silver Ratio Explained: What It Signals for Silver Prices
Silver investors often watch price charts, mine supply reports and industrial demand trends. The gold-silver ratio is simpler: one number that compares the two metals. It does not forecast the future on its own, but it gives context. When silver looks cheap against gold, or expensive, the ratio shows how unusual that relationship is and prompts better questions about why.
What the ratio measures
At its core, the ratio answers a straightforward question: how many ounces of silver does one ounce of gold buy? In price terms, it shows how many times more expensive gold is than silver per ounce. Because both metals are quoted in currency per ounce, the calculation uses the same currency and weight unit for both. The result is a pure number: 60, 80, 100, and so on. A ratio of 80 means gold costs 80 times as much as silver per ounce. When the ratio rises, gold has become more expensive relative to silver, or silver cheaper relative to gold. When it falls, the opposite is true.
The ratio is not a price target for silver. It is a relative-value measure. That distinction matters. Silver can be cheap against gold and still fall in dollar terms if both metals weaken. Gold can be expensive against silver and still rise. The ratio tells you about the spread between two markets, not the direction of either one.
Think of it as a lens rather than a signal. A single ratio reading says little about whether silver is a good buy today. It says something about how the market is pricing two forms of hard asset exposure at the same moment. Investors use that information to compare silver against gold, to compare today against history, and to decide what deserves more research.
How to calculate it
Use one consistent price source. Spot prices, futures prices and dealer prices can differ, especially for silver, where retail premiums vary. Pick a source and stick with it so that changes in the ratio reflect the market rather than a change in your data.
Gold price per ounce ÷ Silver price per ounce = Gold-silver ratio
For a simple illustration, assume gold is quoted at 2,000 currency units per ounce and silver at 25 currency units per ounce. The calculation is 2,000 ÷ 25 = 80. That means one ounce of gold buys 80 ounces of silver at those quoted prices. If gold later rises to 2,100 while silver stays at 25, the ratio becomes 84. If silver rises to 30 while gold stays at 2,000, the ratio falls to about 67.
If you prefer working in grams, the method is the same. Divide the gold price per gram by the silver price per gram. The units cancel, so the ratio remains a clean comparison. The key is consistency: do not divide a gold price per ounce by a silver price per kilogram, and do not mix a New York spot quote with a London fix from a different moment without noting the mismatch.
Keep these practical rules in mind:
- Match the same currency and weight unit for both metals. Mixing dollars per ounce with euros per kilogram produces nonsense.
- Use the same timestamp. Gold and silver trade around the clock, so a gold price from one moment and a silver price from another can distort the reading.
- Record the source and date. A ratio without its inputs is hard to audit later.
- Do not compare a spot-market ratio with a retail-coin ratio. Dealer premiums, fabrication costs and taxes sit outside the metal price.
What high and low readings suggest
A high ratio means silver is inexpensive relative to gold. A low ratio means silver is expensive relative to gold. That is the basic interpretation, and it is useful as far as it goes. The trap is assuming that a high ratio must fall soon or that a low ratio must rise soon. That assumption treats the ratio as a law of gravity rather than a relative price shaped by two separate markets.
Extremes can persist. The ratio can stay high for years if gold is in demand as a defensive reserve asset and silver is weighed down by weak industrial demand. It can stay low if industrial activity is strong and silver is being pulled into electronics, solar panels and other uses while gold lags. A high reading may mean silver is cheap, or it may mean the market expects silver’s fundamentals to remain weak. The ratio does not tell you which explanation is correct. It tells you to investigate.
It is also possible for the ratio to move without silver doing anything unusual. If gold rallies sharply during a period of financial stress, the ratio can jump even if silver holds steady. If gold corrects while silver trades sideways, the ratio can fall. Investors who watch only silver prices can miss half the story.
A high ratio is not a buy signal by itself. It is a prompt to ask why silver is cheap relative to gold and whether that reason is likely to change.
Why the ratio moves
Gold and silver share a monetary history, but they do not respond to the same forces in the same way. Gold is held heavily as a store of value, a reserve asset and a hedge against currency weakness. Silver has a monetary role too, but a much larger share of its demand comes from industrial applications. That difference helps explain why the ratio swings.
When investors are defensive, gold often attracts safe-haven demand while silver can suffer from concerns about industrial slowdown. That combination tends to push the ratio higher. When economic activity improves and industrial demand strengthens, silver often outperforms gold, and the ratio tends to fall. Monetary policy, real interest rates, the U.S. dollar, mine supply, recycling and investment flows all feed into the relationship. No single driver explains every move.
This is why the ratio is best read alongside other information. A rising ratio during a broad risk-off period tells a different story from a rising ratio while industrial production is booming. The number is the same, but the context is not.
Historical context and ranges
The gold-silver ratio has no fixed anchor. Over long periods it has ranged from very low readings near 15 to extreme highs above 100. In modern decades, it has often traded somewhere between roughly 40 and 80, but those boundaries are descriptive, not predictive. The ratio reached a low near 32 in 2011 when silver rallied strongly, and it spiked toward 120 in 2020 when gold held up better than silver during the initial pandemic shock.
History is useful for perspective, not for precise forecasts. A ratio of 90 may look high against a ten-year average, but that does not mean it will quickly return to 60. Structural changes in industrial demand, investment flows and monetary policy can shift the range itself. Treat historical ranges as a starting point for comparison, not as a promise of mean reversion.
How investors use the ratio
Many investors use the ratio as a relative-value gauge. If the ratio is high by historical standards, they may look more closely at silver. If it is low, they may favor gold. Some use it to rotate between the two metals, while others use it to size positions or to decide which metal deserves more attention in a diversified hard-asset allocation. The ratio is most useful when it is combined with a thesis about why the relationship is stretched.
For example, suppose gold is $1,980 and silver is $22, giving a ratio of 90. An investor who expects the ratio to fall to 70 and gold to stay flat would calculate an implied silver price of about $28.29: 1,980 ÷ 70 = 28.29. But if gold falls to $1,800 while the ratio returns to 70, silver would need to reach about $25.71. The outcome depends on both metals. That simple example shows why the ratio is a relative tool, not a standalone silver price forecast.
Practical uses
- Compare against history: Look at the current ratio relative to its one-year, five-year and ten-year ranges.
- Check the drivers: Ask whether gold, silver or both are moving, and why.
- Use it as a prompt: Let an extreme reading trigger research rather than an automatic trade.
- Respect volatility: Silver is more volatile than gold, so ratio-based trades can move against you quickly.
Limitations and common mistakes
The ratio has several limitations. It is not a valuation model. It does not account for mining costs, above-ground inventories, industrial demand growth or changes in monetary regimes. It can be distorted by currency moves if the two metals are not quoted in the same currency. It can also mislead when retail premiums are high, because the price an investor pays for physical silver may differ significantly from the spot price used in the calculation.
- Assuming a high ratio must immediately fall, or a low ratio must immediately rise.
- Using mismatched timestamps or currency units.
- Ignoring the reasons behind the ratio move.
- Confusing spot ratios with retail purchase ratios.
- Treating the ratio as a guaranteed timing signal.
A practical checklist for reading the ratio
- Use one consistent data source for both metals.
- Calculate the ratio with the same currency, weight unit and timestamp.
- Compare the result with recent and long-term ranges.
- Identify whether gold, silver or both are driving the change.
- Check the broader context: real yields, the dollar, industrial demand and risk sentiment.
- Write down a clear thesis before acting, including what would prove it wrong.
- Manage risk, especially if using leveraged or short-term instruments.
The gold-silver ratio is a compact way to compare two markets that share a monetary heritage but respond to different forces. It can show when silver looks cheap or expensive against gold, and it can prompt useful questions about supply, demand and investor behavior. But it is not a crystal ball. Used with discipline and context, it is a practical reference point for silver investors who want to understand relative value without mistaking one number for a complete forecast.
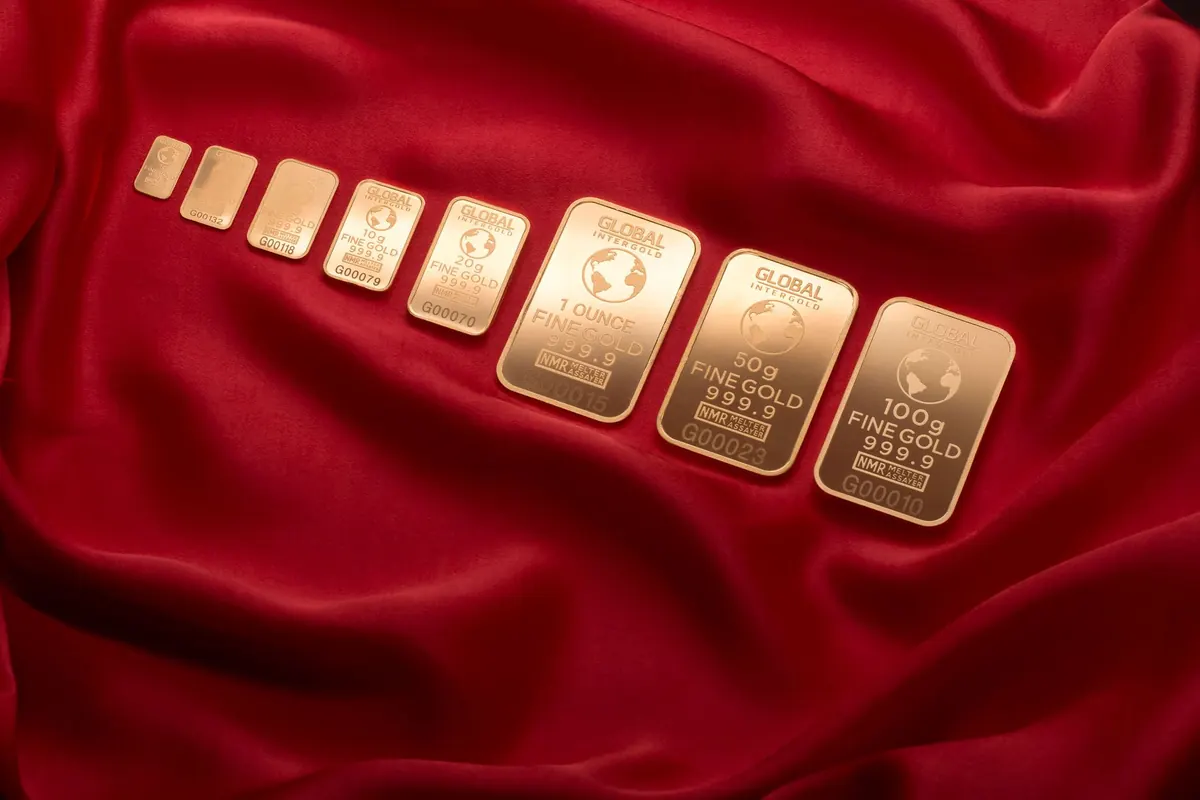
Photo: Michael Steinberg / Pexels

How Recycled Silver Moves from Electronics to Refined Bars
Recycled silver travels a long road from circuit boards and old contacts to 999-fine bars. Here is how...

Silver Purity Marks for Beginners: 925, 958, and 999 Explained
A plain-English guide to silver purity marks — what 925, 958 and 999 mean, how to read the rest of a...
About Us